Calm Tape, Restless Engine: This Week's Hidden Rotation
VIX fell, breadth hit 91% — but the regime engine is flagging a rapid shift two days out…

The surface looks placid. The S&P 500 ticked up +0.34% on the week, VIX fell to 17.68, and 91% of sectors finished green. The engine underneath is anything but calm. Here’s what the data shows.
Capital rotated out of this year’s winners (Tech, Energy) and into Materials, Staples and Real Estate — with breadth staying broad.
It was a quietly broad week. SPY closed at $741.75 (+9.07% YTD, 2.5% off its high). QQQ added +0.74% to $721.34 (+17.57% YTD). The Dow gained +0.82%. The standout, though, was small caps: IWM jumped +3.11% to $292.95 and now leads the majors at +19.22% YTD. When the smallest, most rate-sensitive cohort leads while the mega-cap winners cool, that’s a participation signal worth taking seriously.
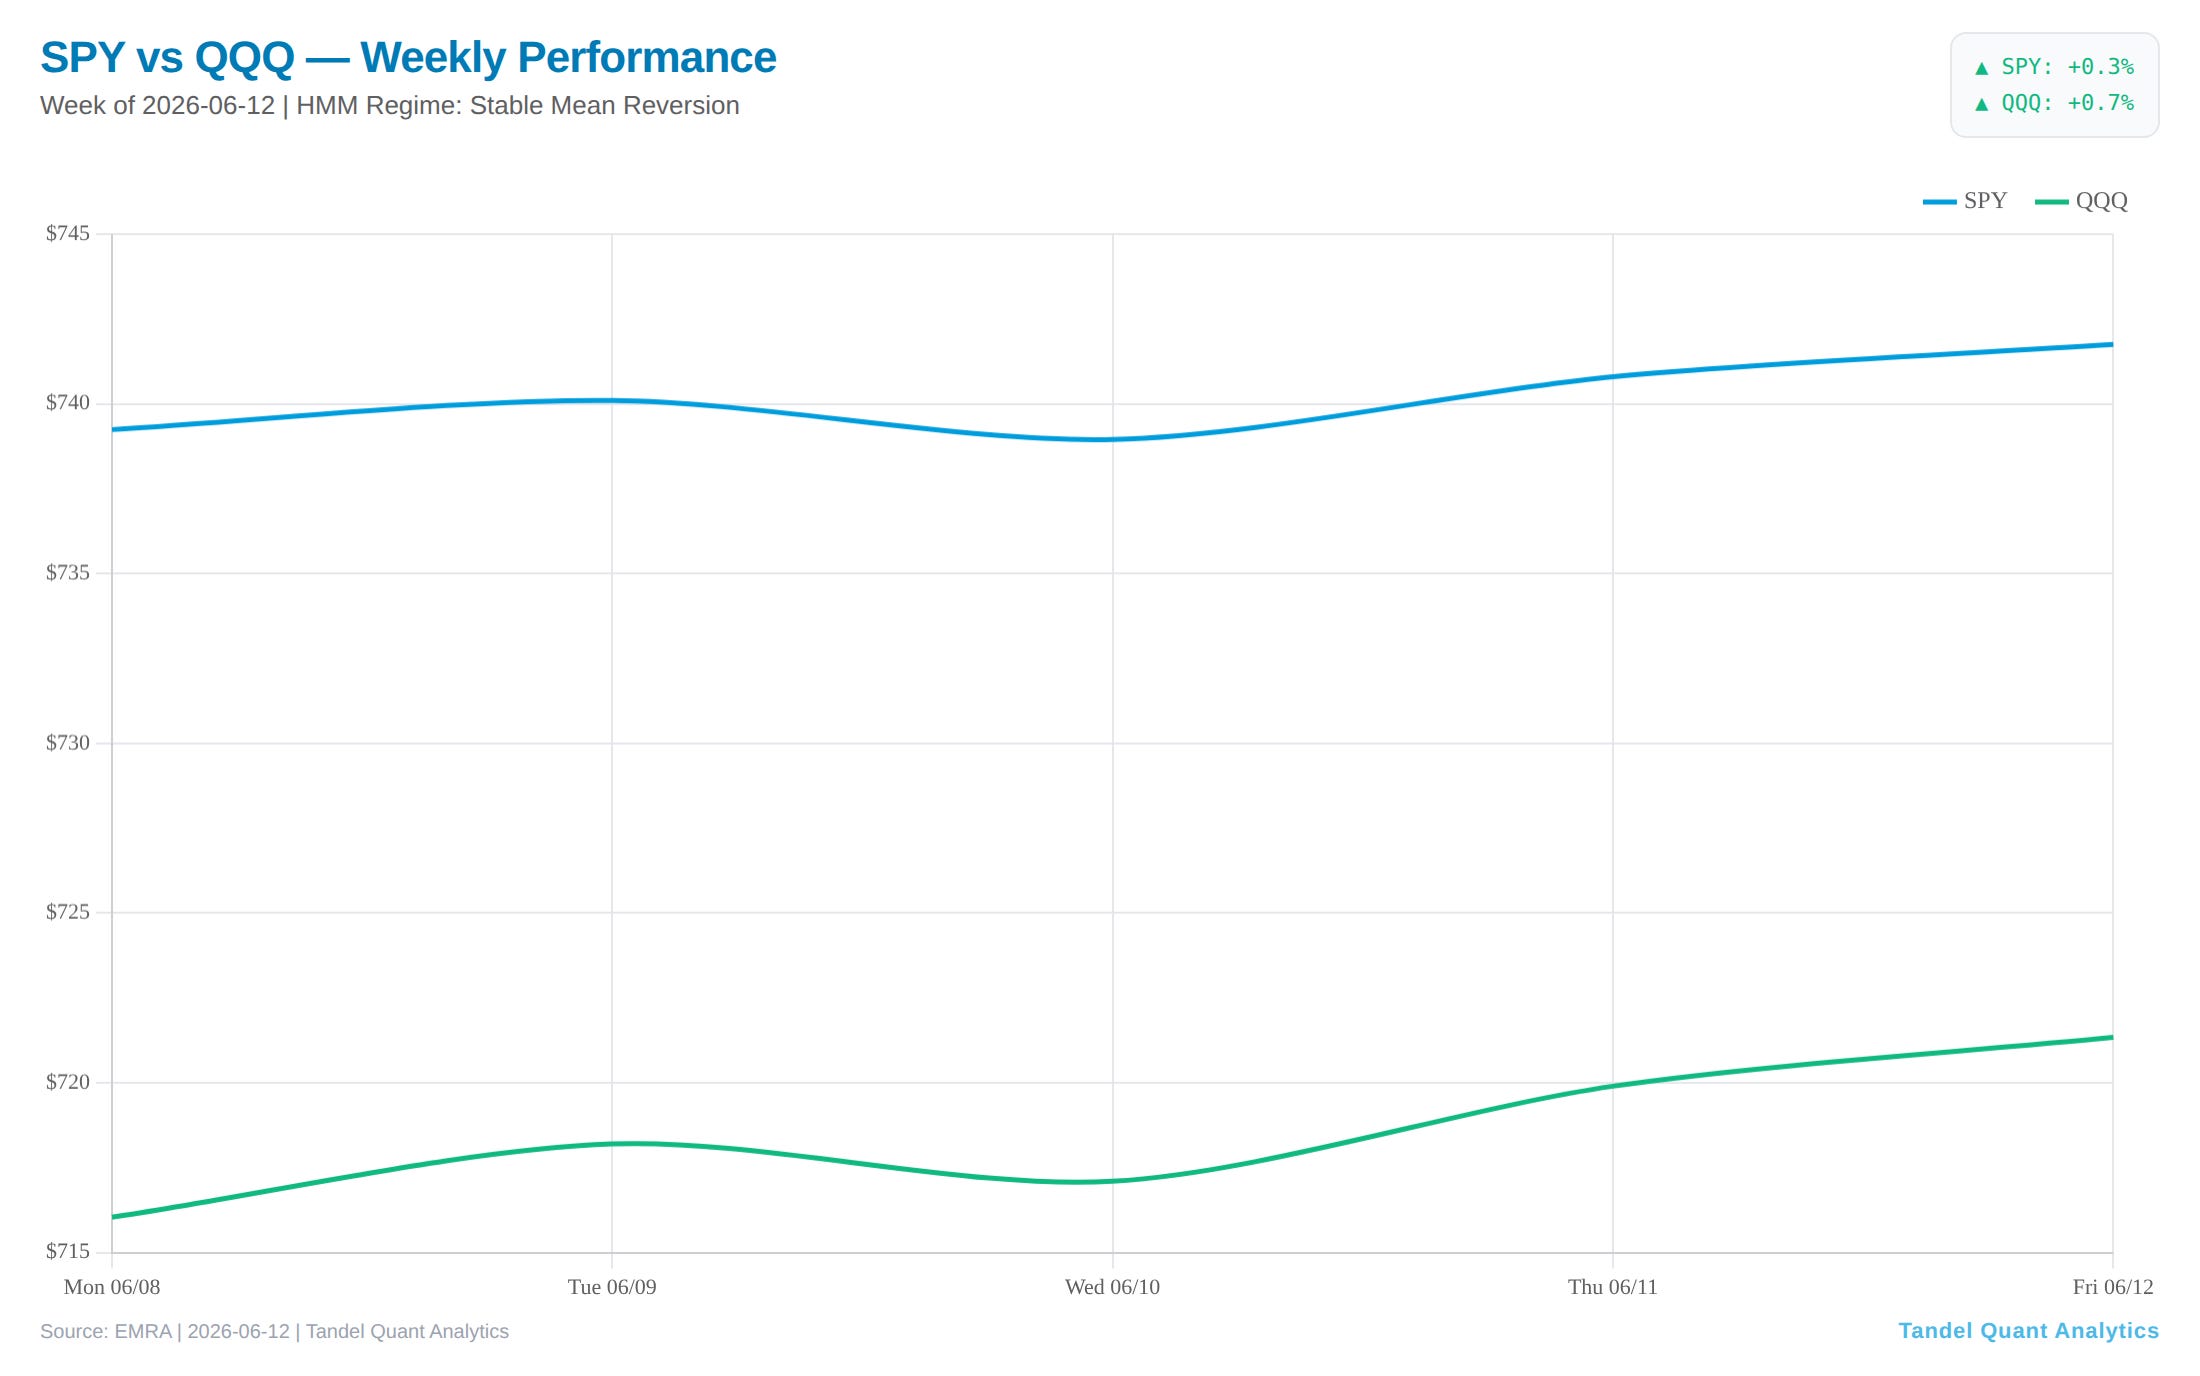
Large-cap indices drifted higher; the real move was beneath them in small caps and the sector mix.
Volatility says calm. The regime model says “not so fast.”
VIX dropped 1.24 points to 17.68 — NORMAL, with the curve in contango at the 33rd percentile. On its own, calm. But the regime engine is layered. In-sample, the HMM reads LOW_VOL_MEAN_REVERT with high stability (0.95, trimmed to 0.85 after the Cornish-Fisher haircut) and a modest 15.2% shift probability.
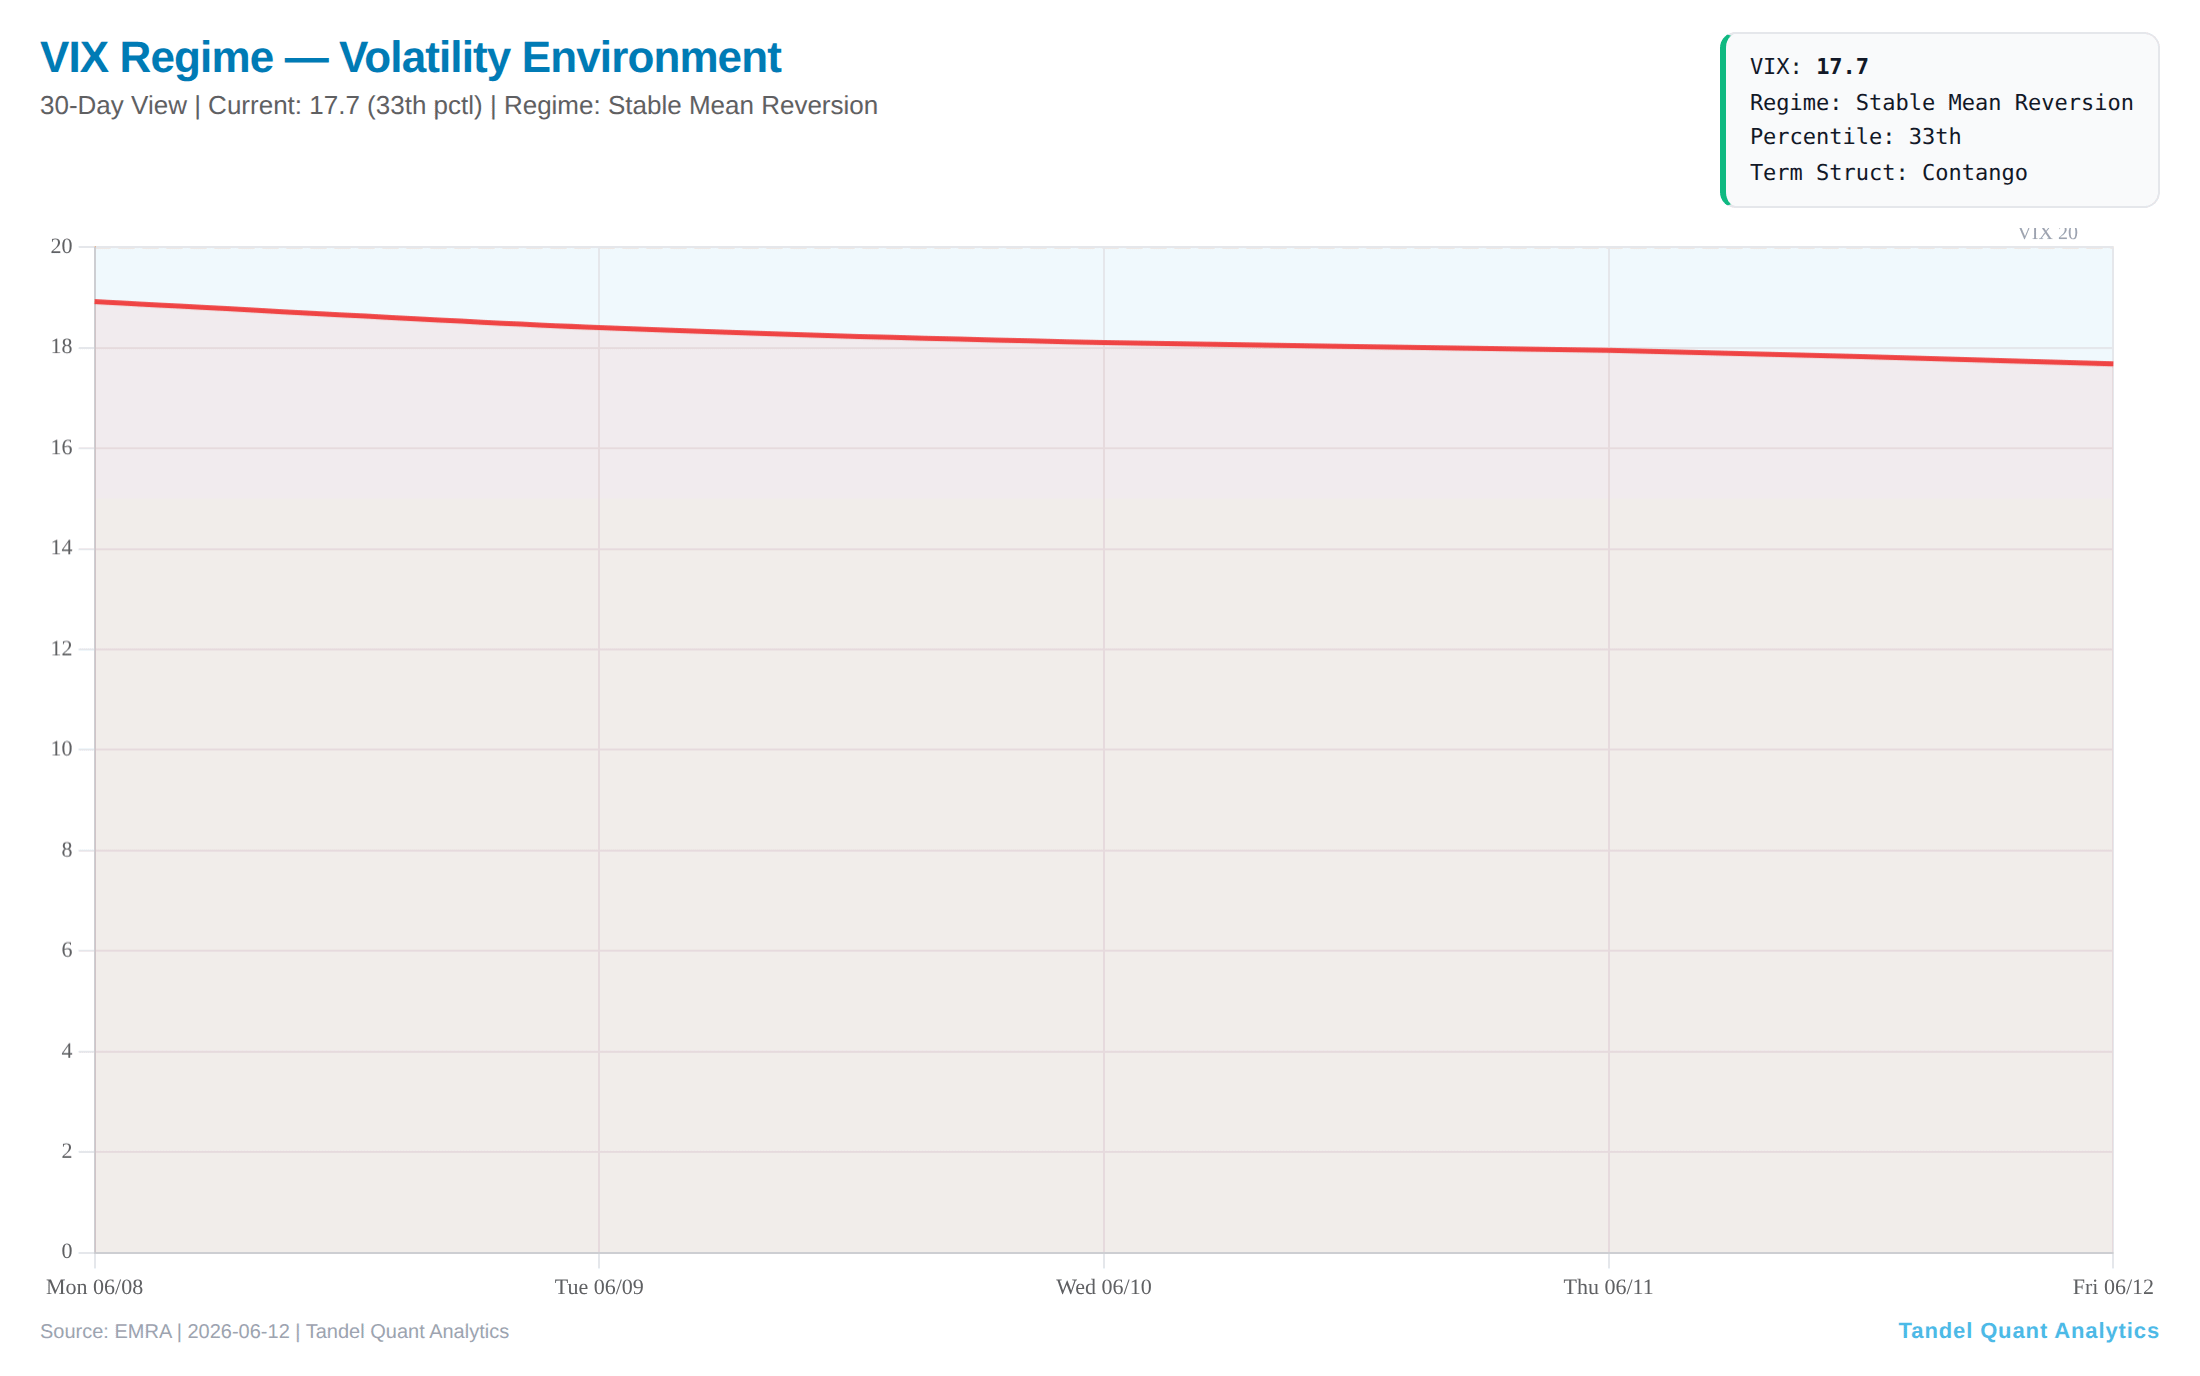
VIX in NORMAL territory, contango intact — the calm that the rest of the engine is quietly questioning.
The tension surfaces in walk-forward validation. The out-of-sample HMM agrees on the headline label (confidence 1.00) — but its probability vector is 99.9% weighted to LOW_VOL_TRENDING, a different regime than the discrete label suggests. The adjustments that flow from that vector are more cautious than the in-sample read: a TCS adjustment of −0.05 and a size multiplier of 0.75x. Transition momentum scores 0.240 and trips a RAPID_SHIFT alert. Crucially, the early-warning module shows no adverse (HIGH_VOL_TRENDING) momentum building — so this is a shift within the low-vol family, mean-revert drifting toward trending, not a break toward stress. It’s not a reason to hide. It is a reason to travel lighter.
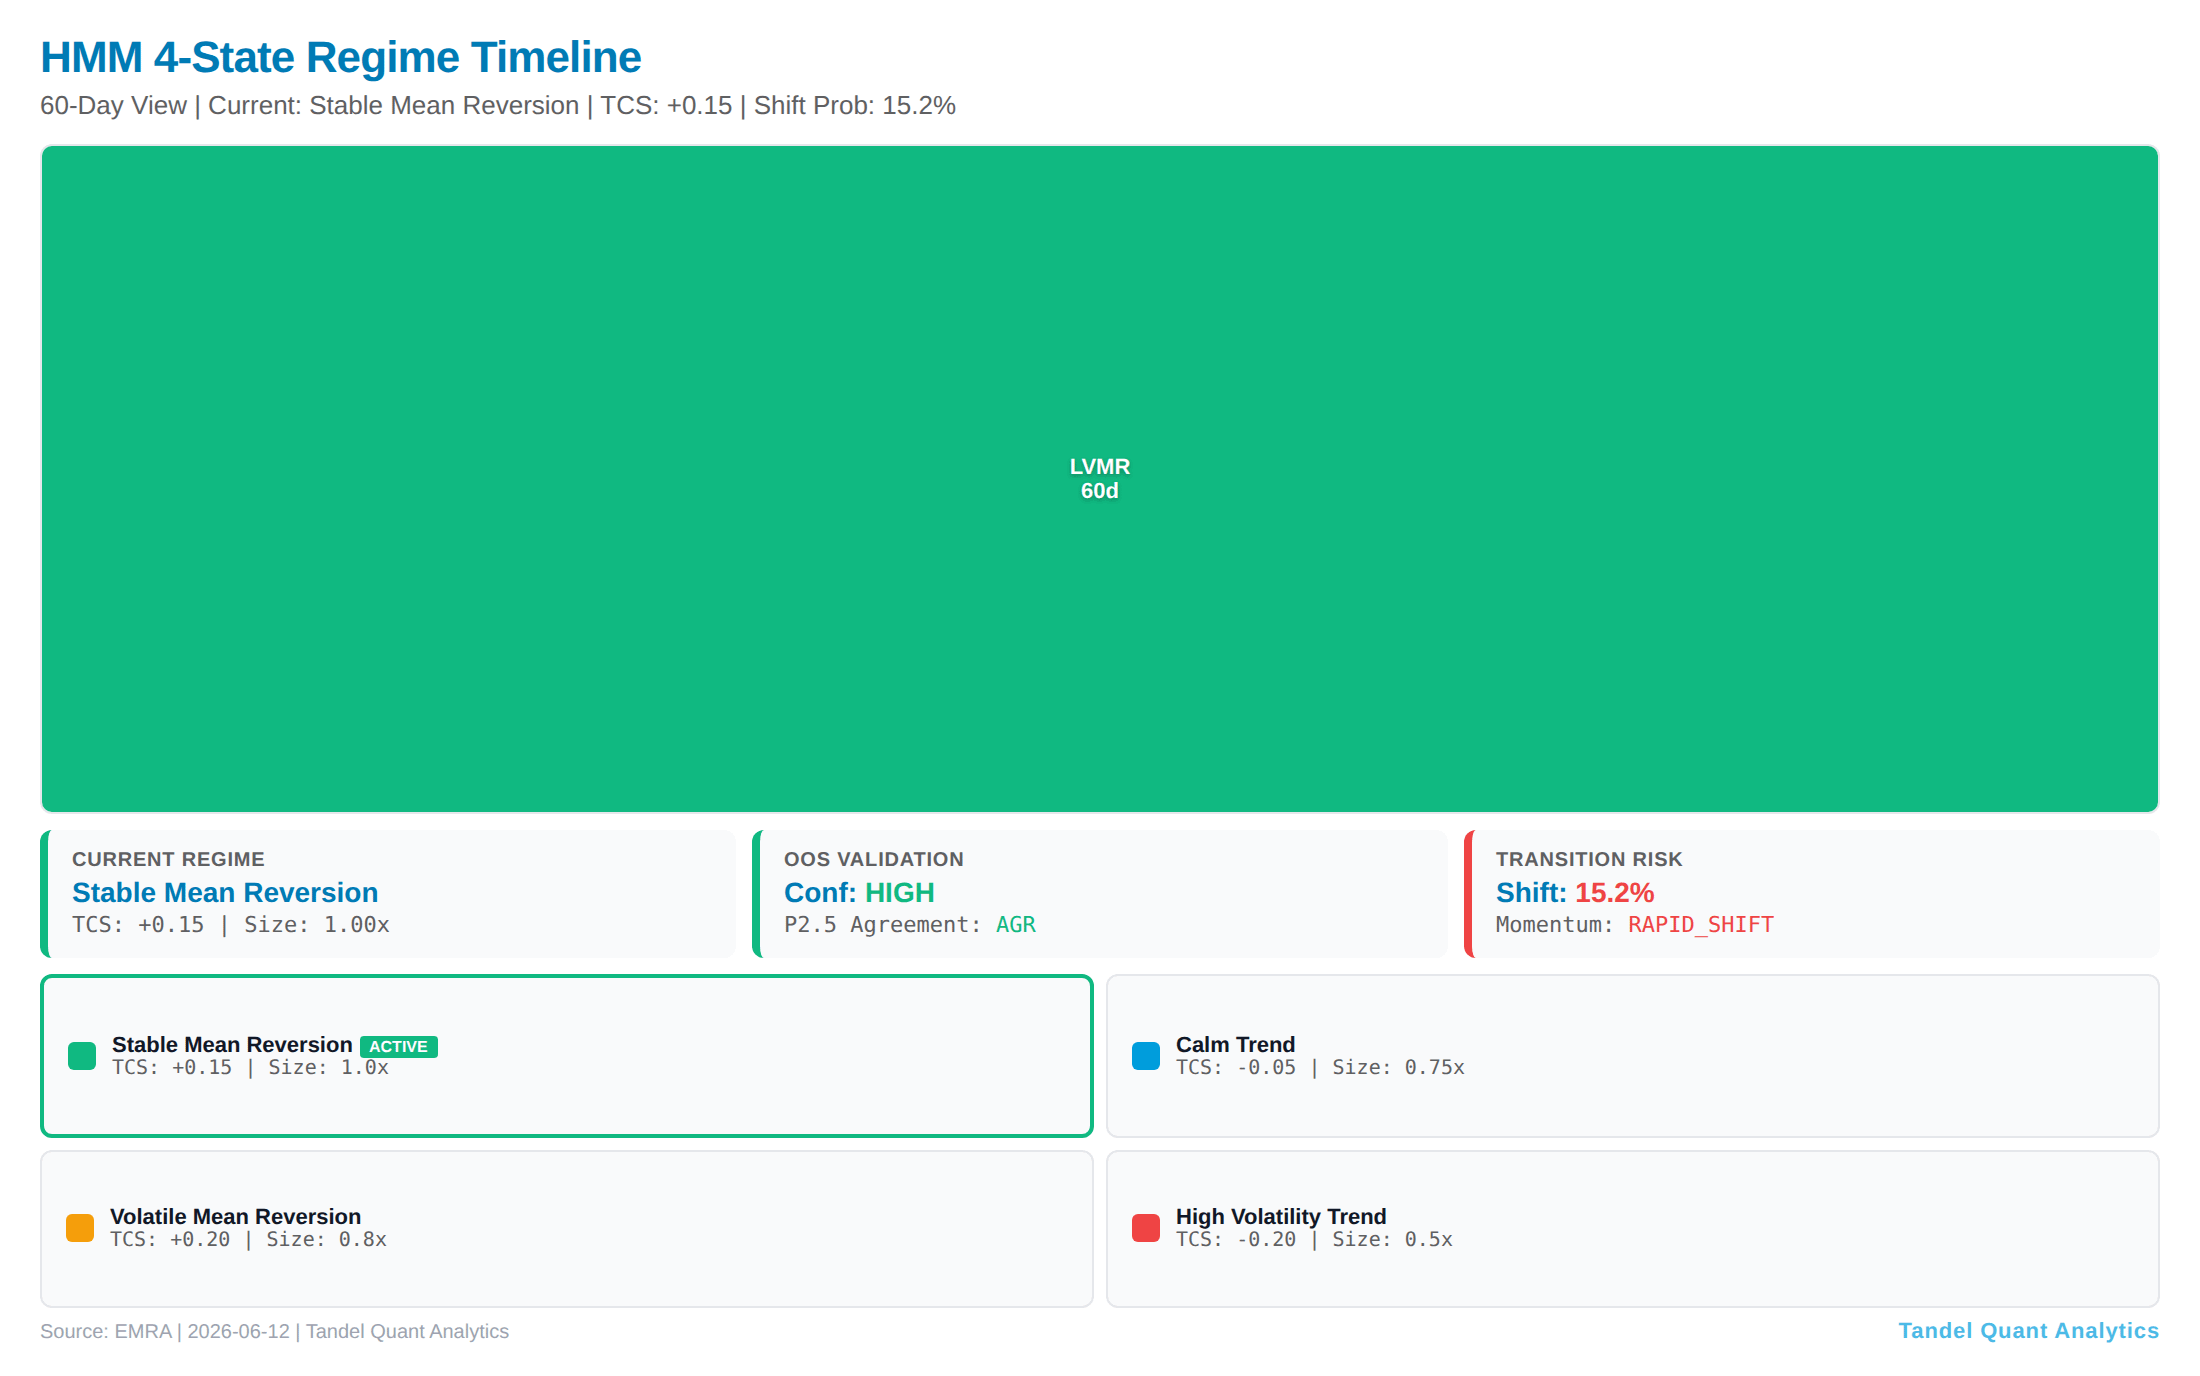
The current regime block, with the OOS vector leaning toward trending — the source of the rapid-shift flag.
GARCH supports the moderate read: a 17.9% annualized vol forecast, persistence of 0.968, and a 21.6-day half-life. Volatility isn’t collapsing, and a shock would decay slowly rather than snap back.
The rotation is the story
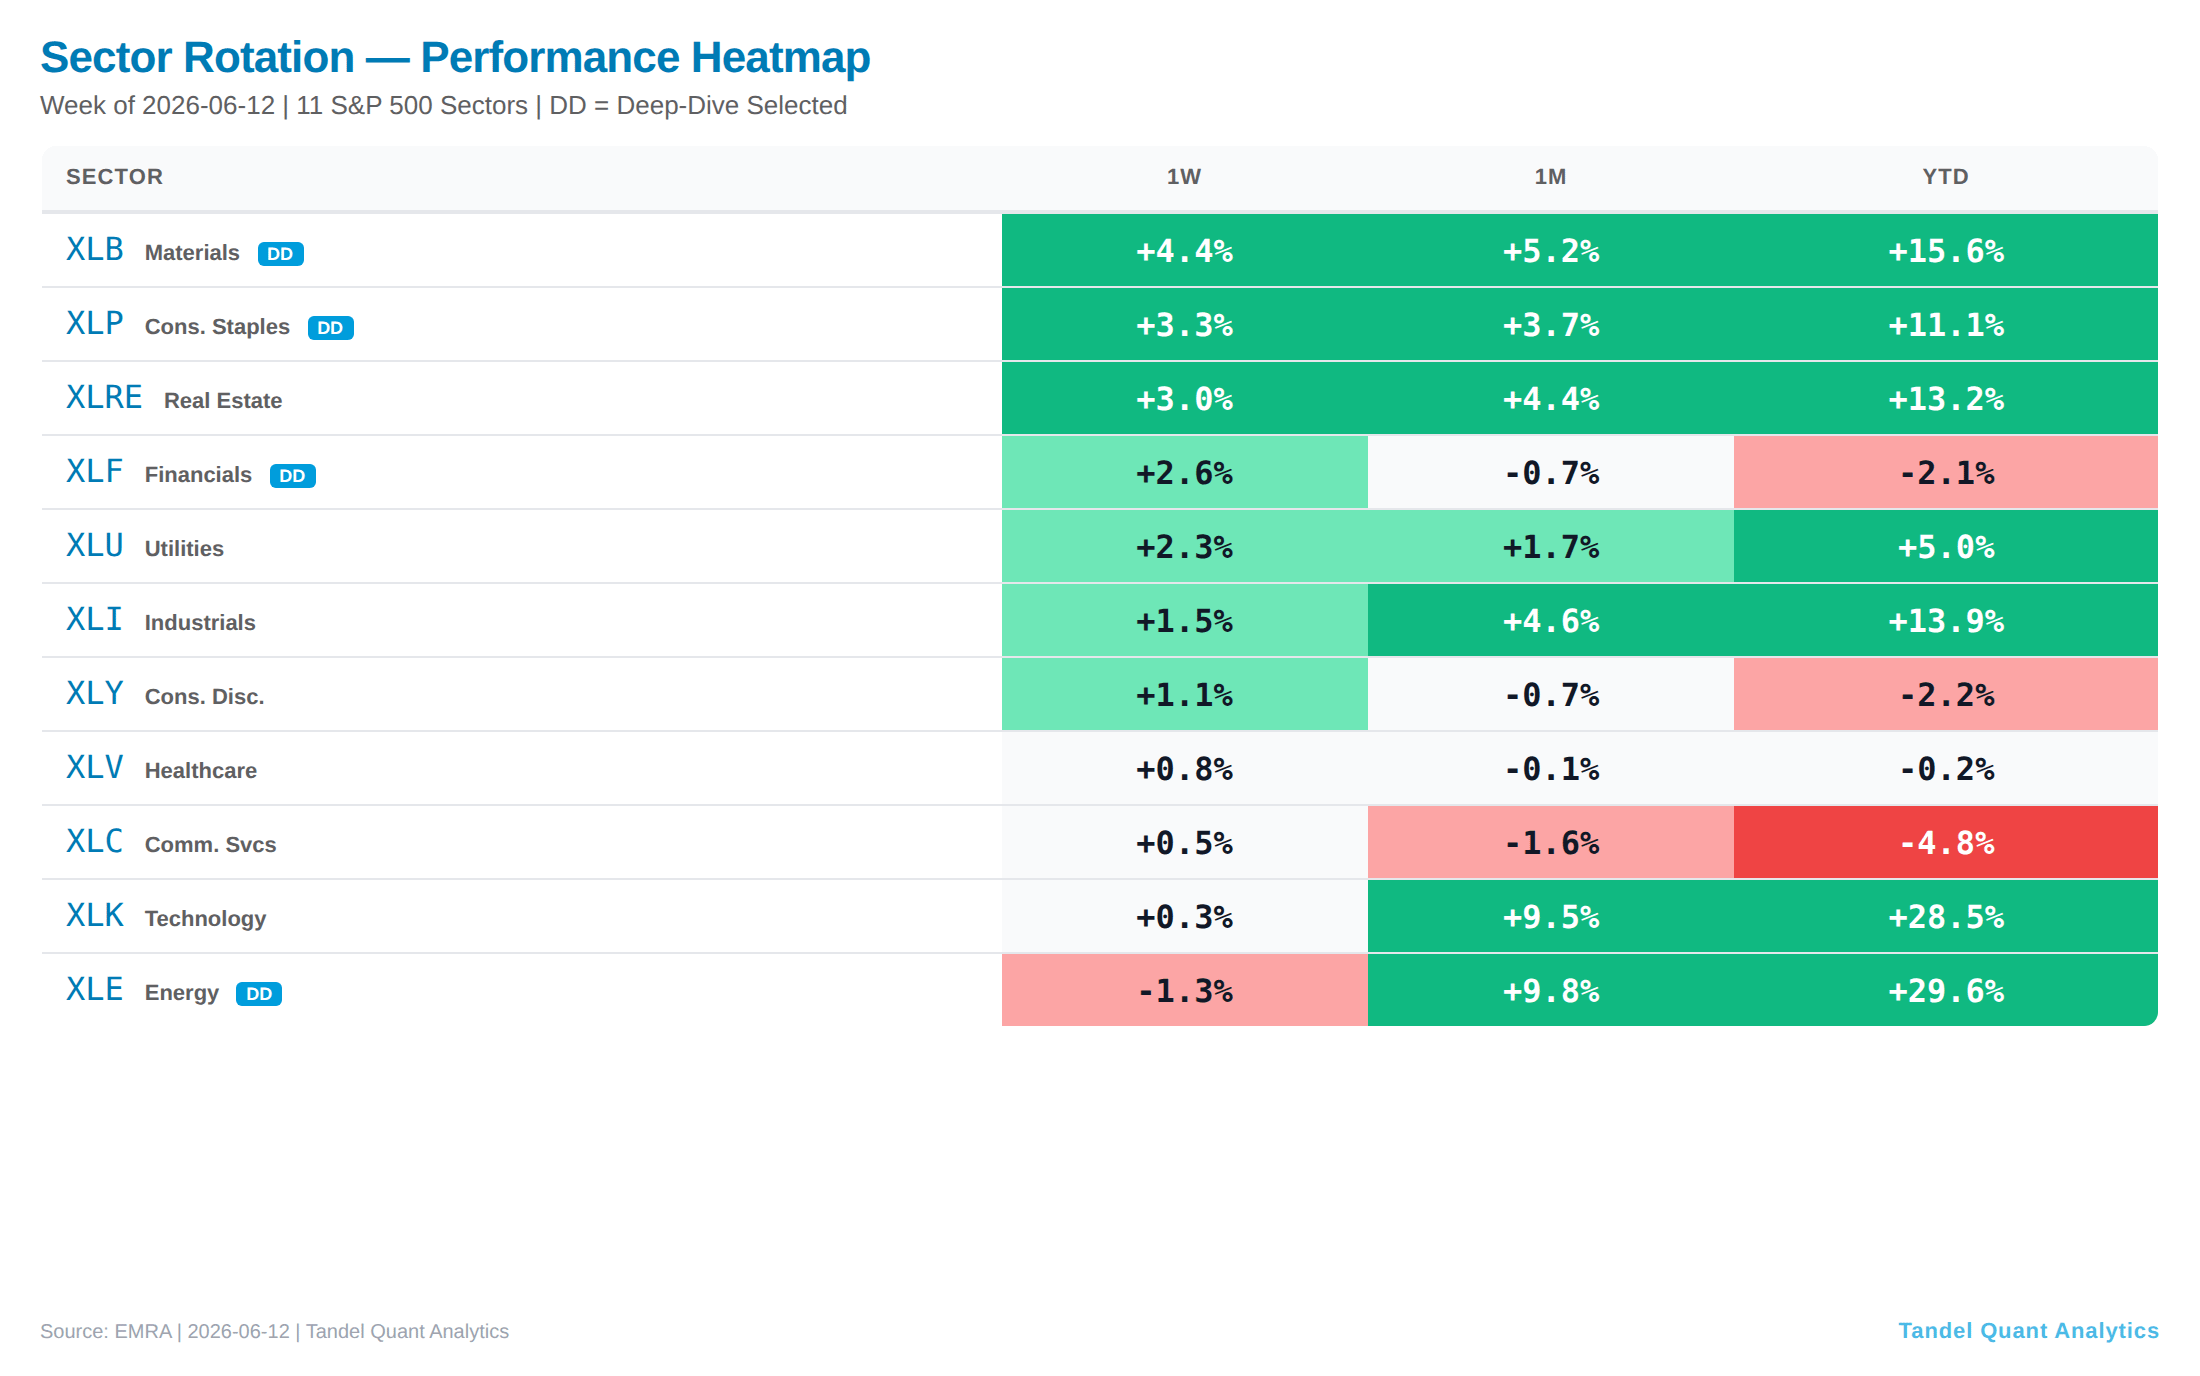
The weekly leaderboard was led by Materials (+4.44%), Consumer Staples (+3.31%) and Real Estate (+3.02%), with Financials (+2.64%) and Utilities (+2.32%) close behind. The laggards were the year’s champions: Technology (+0.34%) and Energy (−1.34%) — even though those two still hold the top two YTD spots (Energy +29.56%, Tech +28.52%).
That’s textbook rotation: money leaving extended winners for laggards and defensives while breadth stays broad. Dispersion is WIDE (5.78% spread) and average pairwise correlation is just 0.178 — these are idiosyncratic, name-by-name moves, not one macro tide. For a process-driven trader, that’s the most useful regime there is: edges live in selection, not in beta.
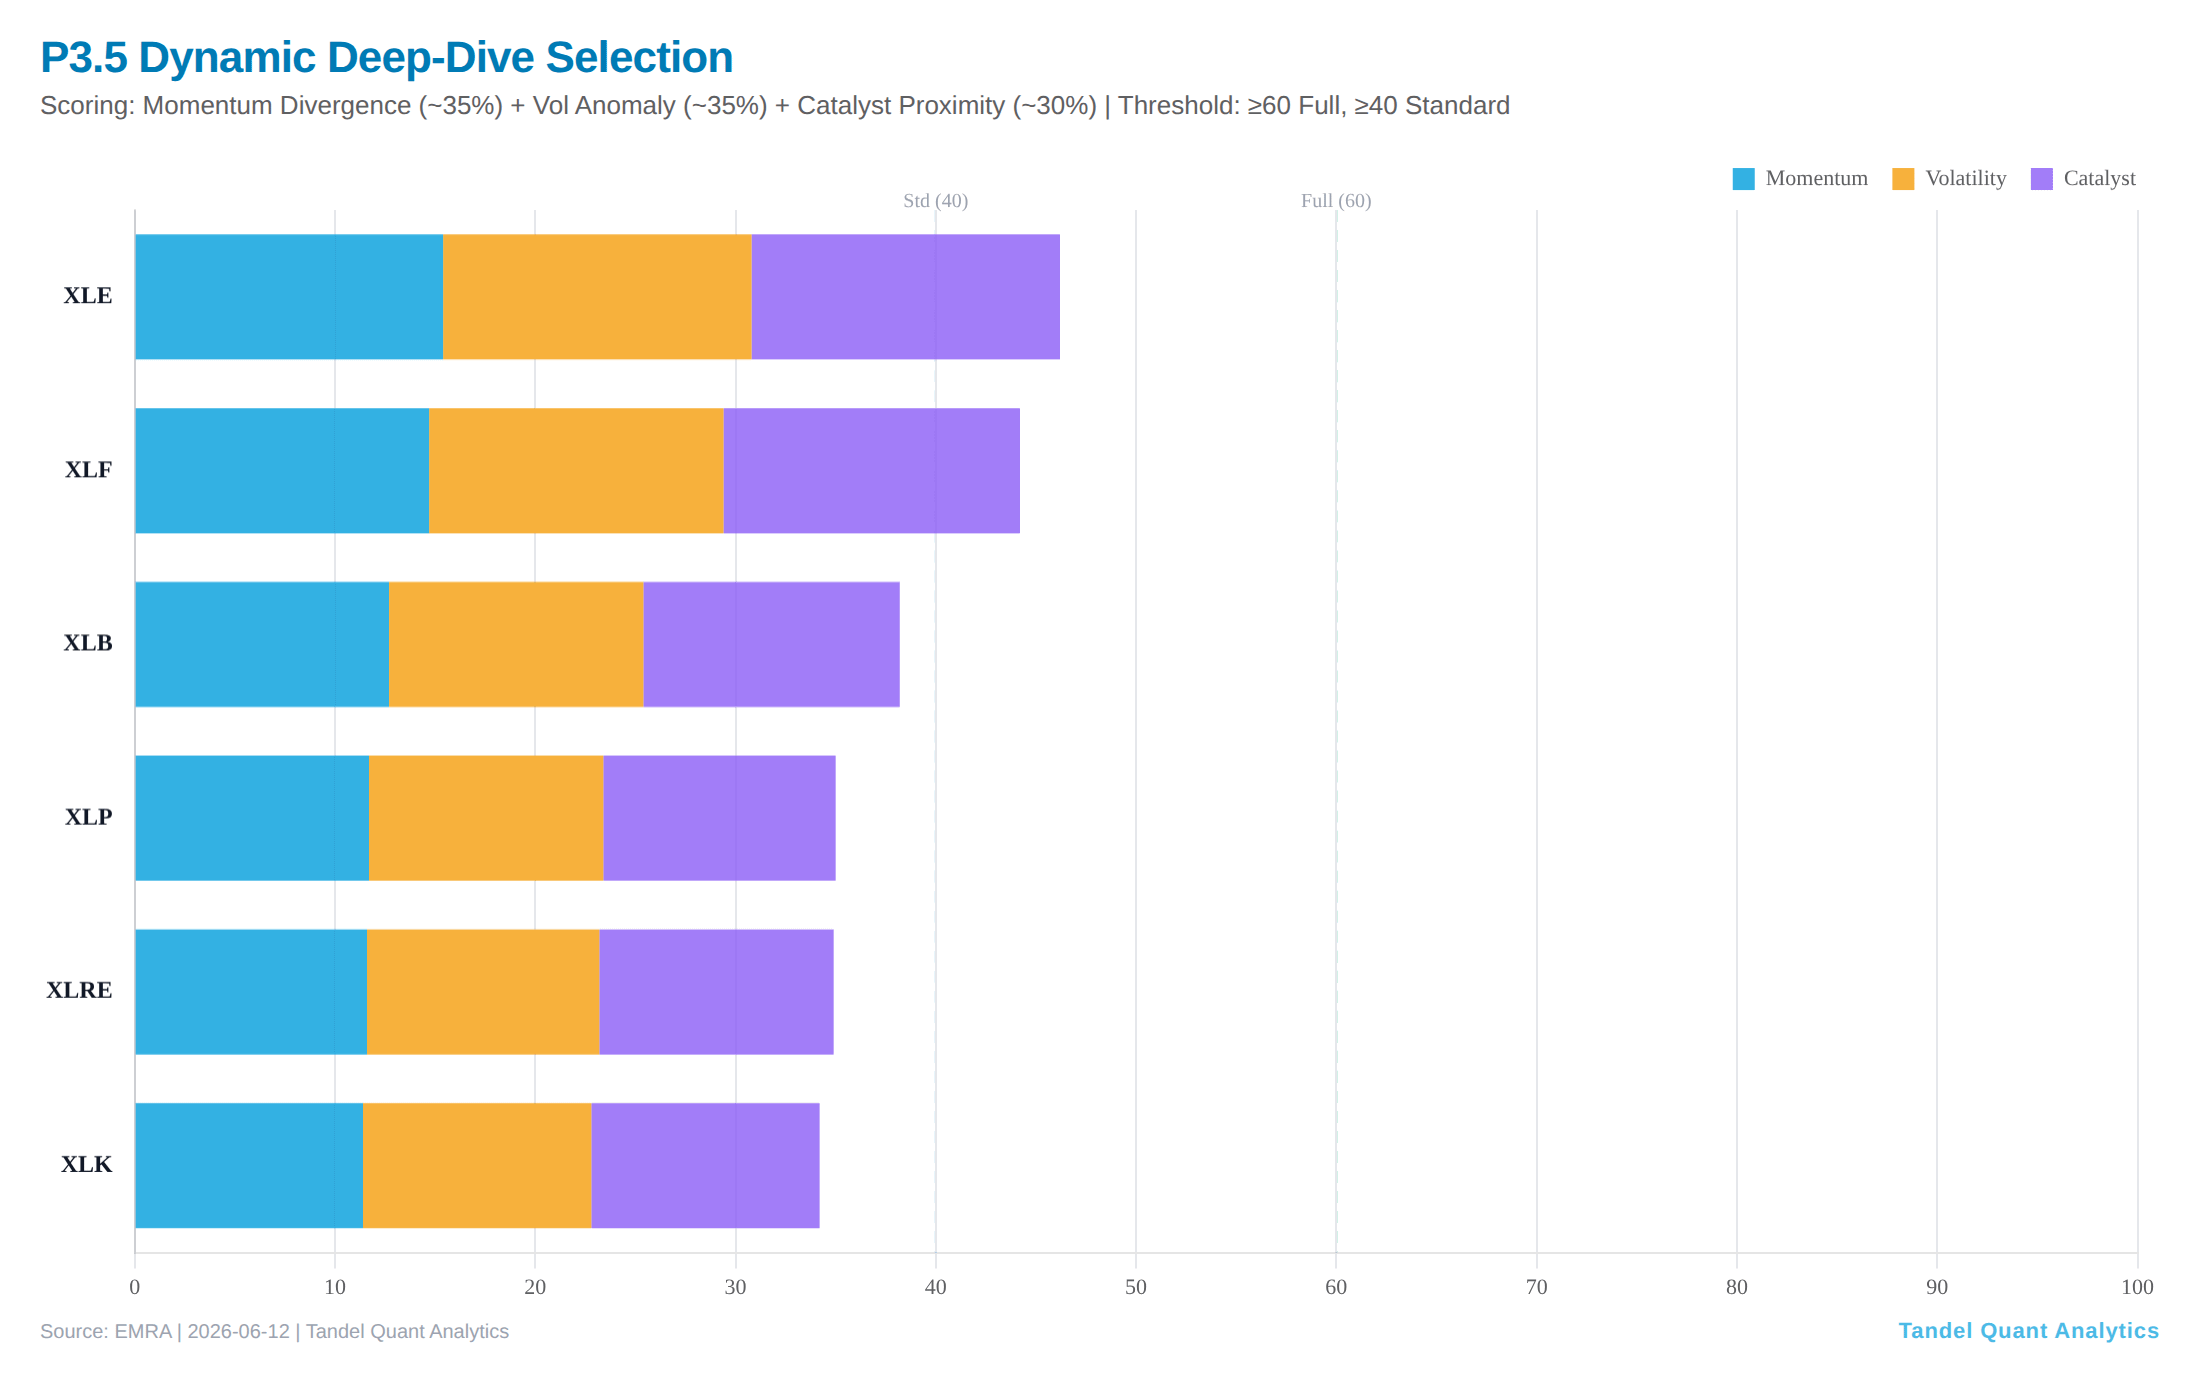
The deep-dive selector flagged Energy, Financials, Materials and Staples. (Bars show the reported composite score; component split shown evenly for illustration.)
The quiet warning in the tails
Here’s where calm earns a second look. Cornish-Fisher flags negative skew of −0.21 (TAIL_RISK) and excess kurtosis of 1.40, nudging the 5-day 95% VaR from −2.52% to −2.58% and CVaR to −3.47%.
The backtest is the part to internalize. Across 499 out-of-sample days, both the 95% and 99% CF VaR bands are MISCALIBRATED — the 95% band was breached 9.4% of the time (vs. a 5% expectation), the 99% band 2.8% (vs. 1%). The Kupiec test rejects calibration at both levels. The CF adjustment is still better than a naïve normal assumption (8.3% closer at 95%, 50% closer at 99%), but the message is blunt: realized downside has been fatter than even the fat-tail model expected, and the tail parameters themselves have been unstable (stability score 0.000). Respect the tails; don’t lean on the band.
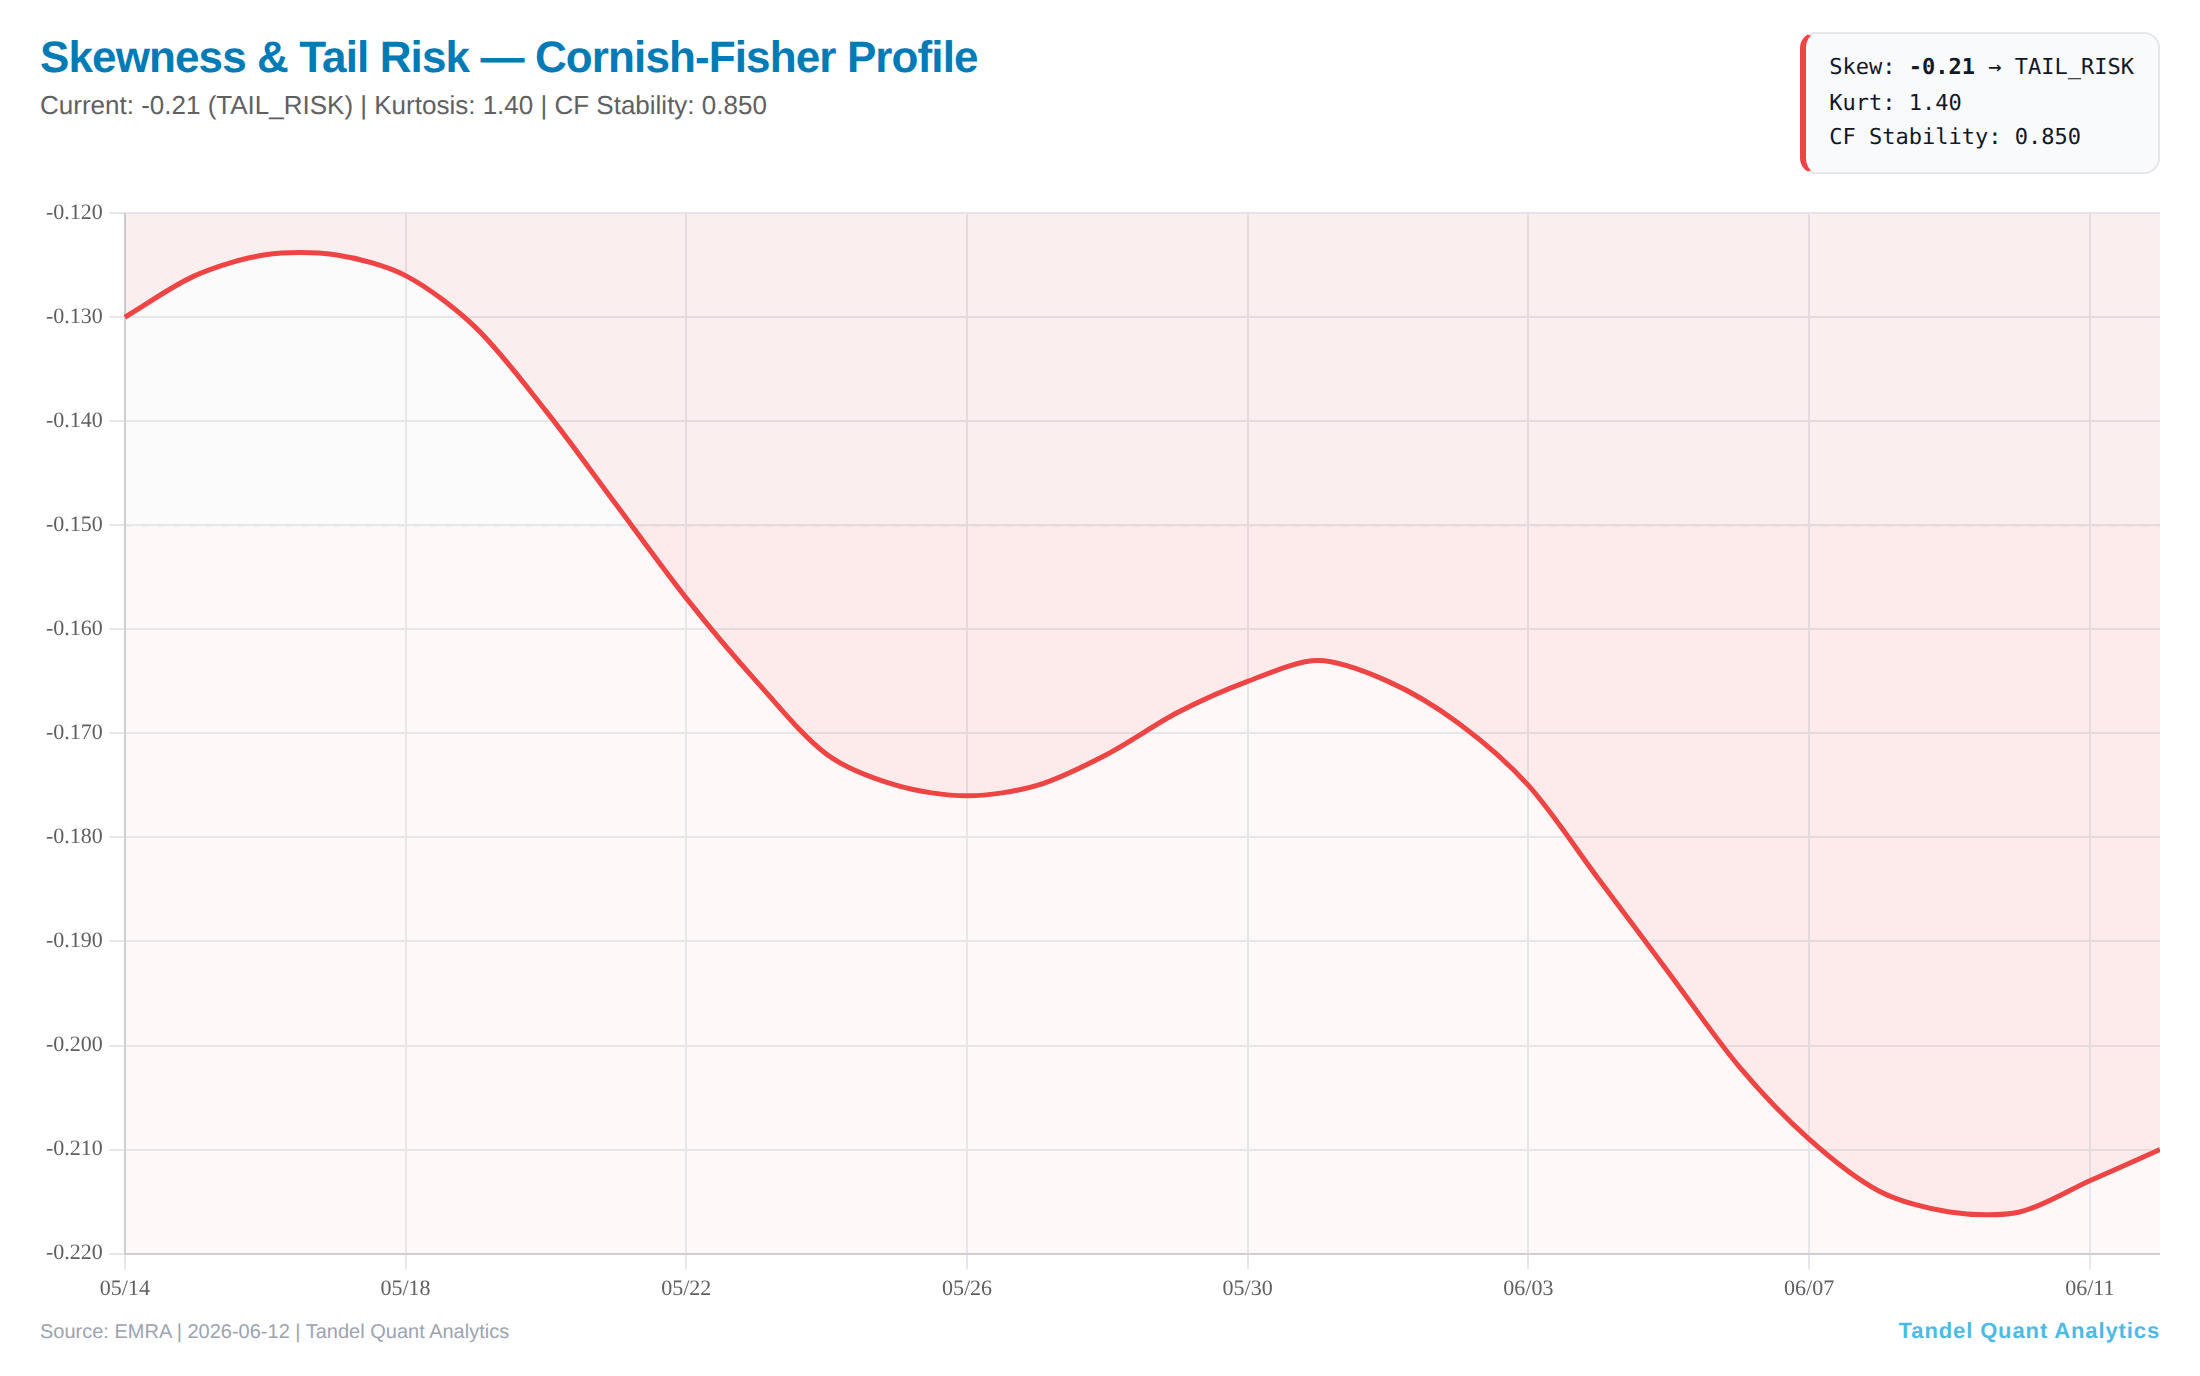
Negative skew with a model that’s been under-predicting real downside — a reason for defined risk, not directional swings.
Forward look
The calendar dominates. FOMC lands June 16–17, two trading days out. The engine’s CF-adjusted scenario split is close to a coin flip: 54.4% “Dovish-Enough Hold, breadth persists” vs. 45.6% “Hawkish Dot-Plot Repricing, vol spike.” The 1.6-point drift from base to CF-adjusted reflects fat tails redistributing probability toward the hawkish outcome.
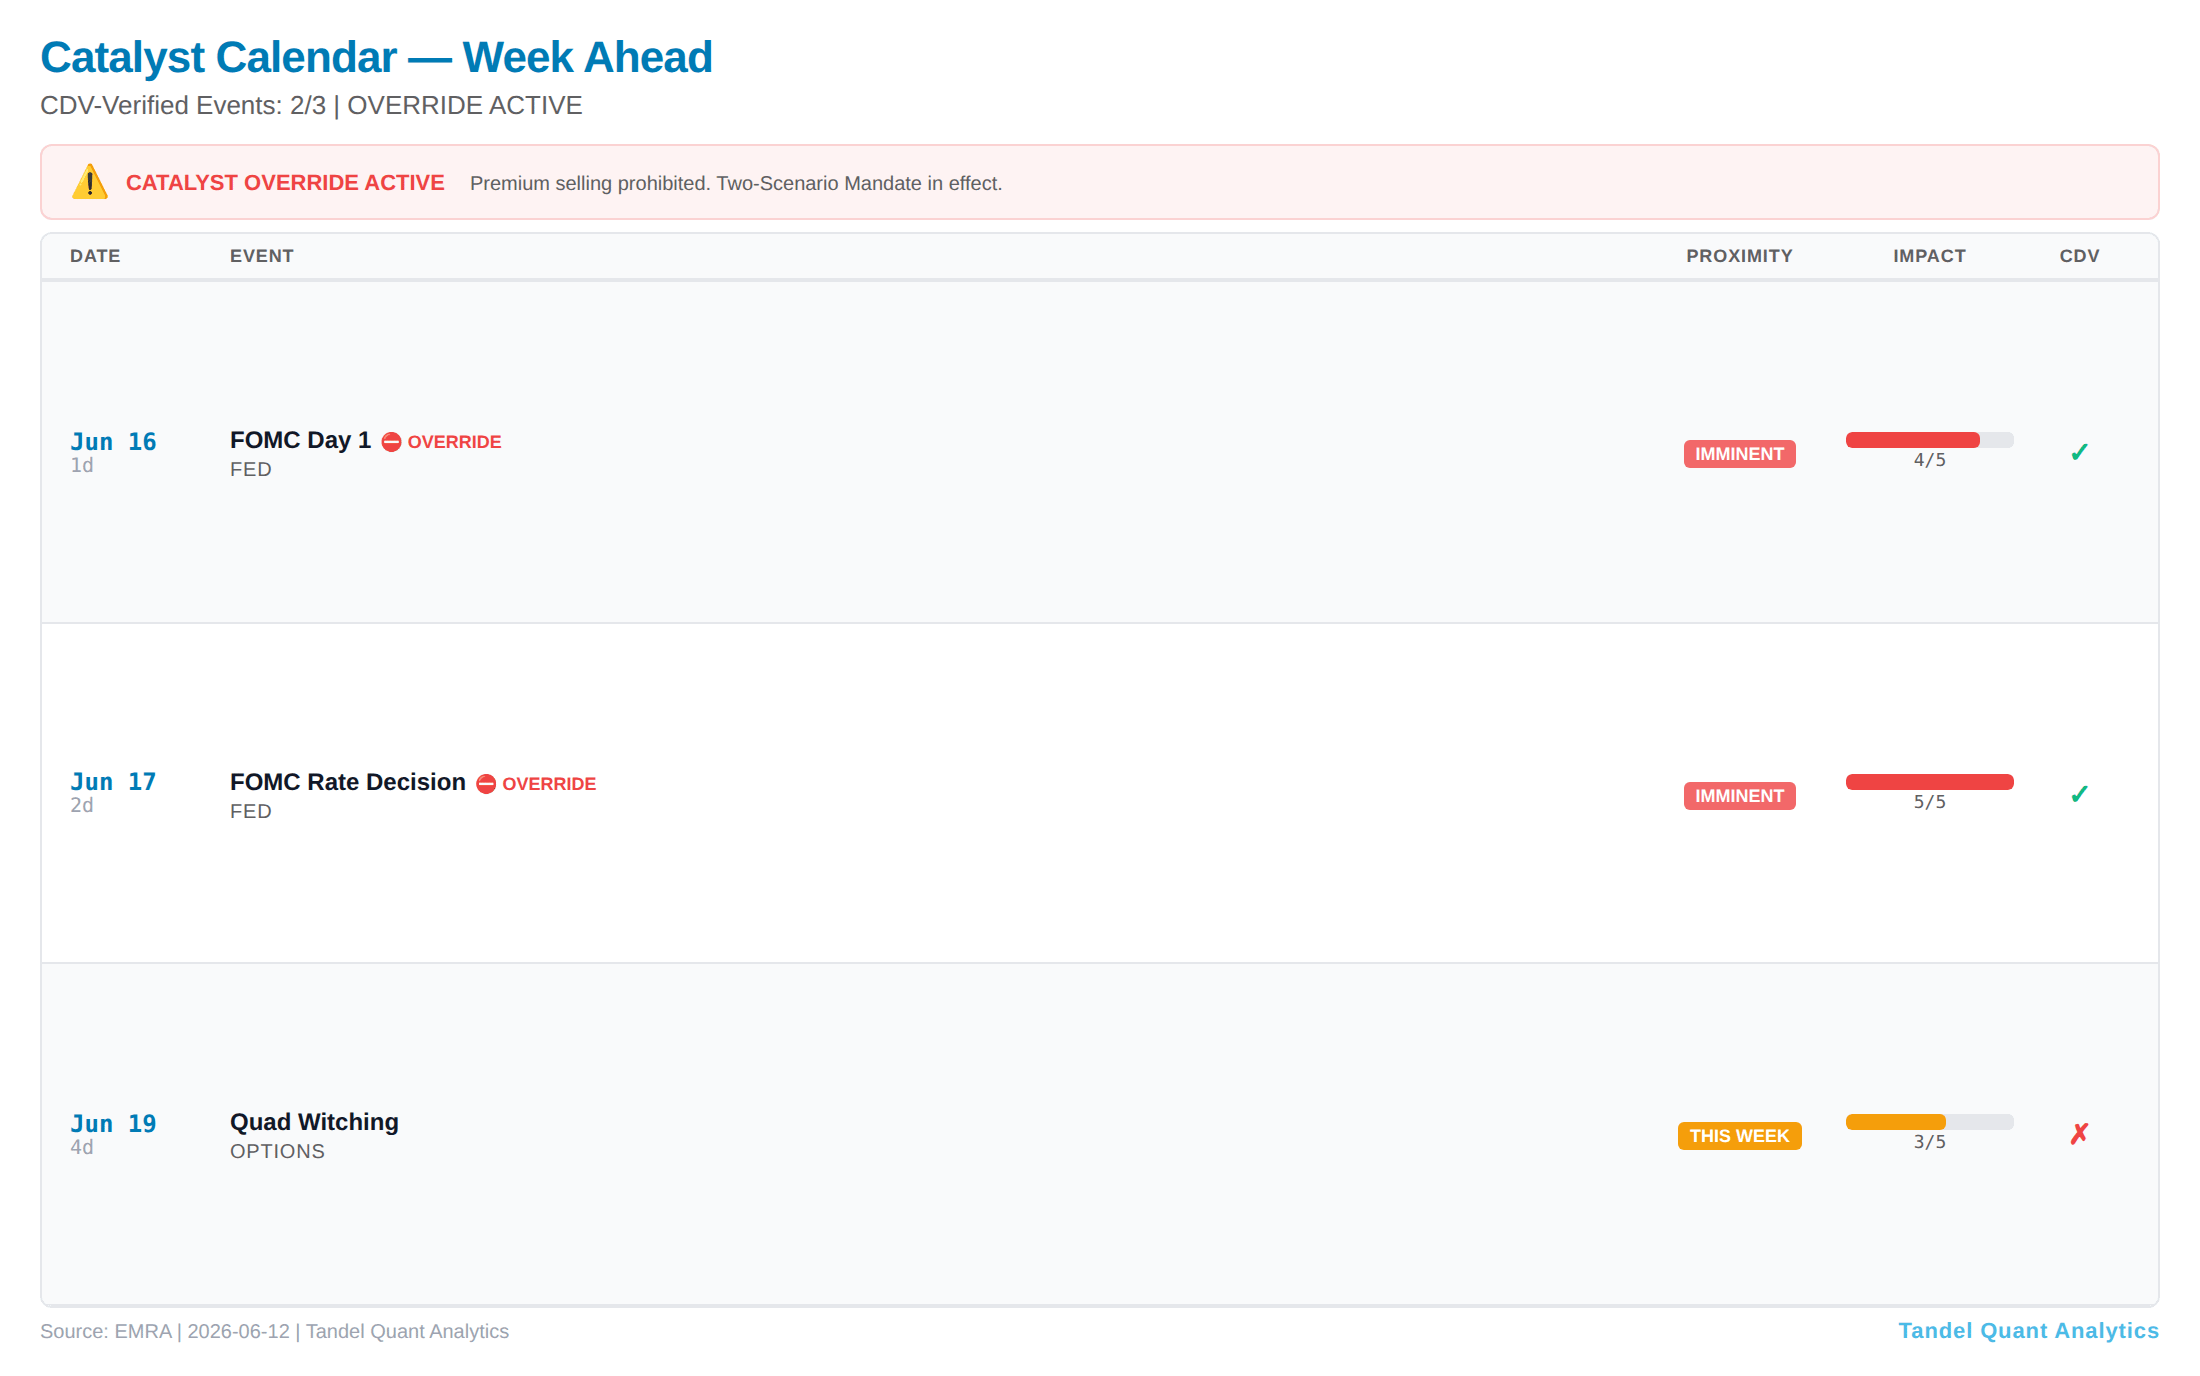
A CDV-verified, override-grade catalyst in 48 hours — the dominant feature of the next two weeks.
The bottom line: a broad, healthy-looking tape with a rotation worth respecting and three quiet warnings under the hood — a regime model leaning toward trending with a rapid-shift flag, VaR models running hot, and a binary catalyst in two days. None of that is a sell signal. All of it argues for the 0.75x size the engine is already calling for, defined risk over directional bets into the print, and a close watch on whether the rotation broadens or reverses after the Fed.
Watchlist into the Fed: XLB / XLP follow-through vs. XLK / XLE stabilization; IWM relative strength holding; VIX behavior around the decision; and whether the OOS probability vector swings back toward mean-revert or keeps drifting to trending.
What’s your read — does the rotation survive the Fed, or snap back to the YTD winners? Drop a comment; I read every one.
If this was useful, share it with someone who trades options. EMRA v4.5.0 | Tandel Quant Analytics. For informational purposes only. Not financial advice.